Data Visualization
Bike Thefts in Toronto City
Size ·················· 18x12”
Medium ············· Print
Duration ············ Feb 2020 (3 weeks)
Tool ·················· Google Sheets, Illustrator
Project Summary
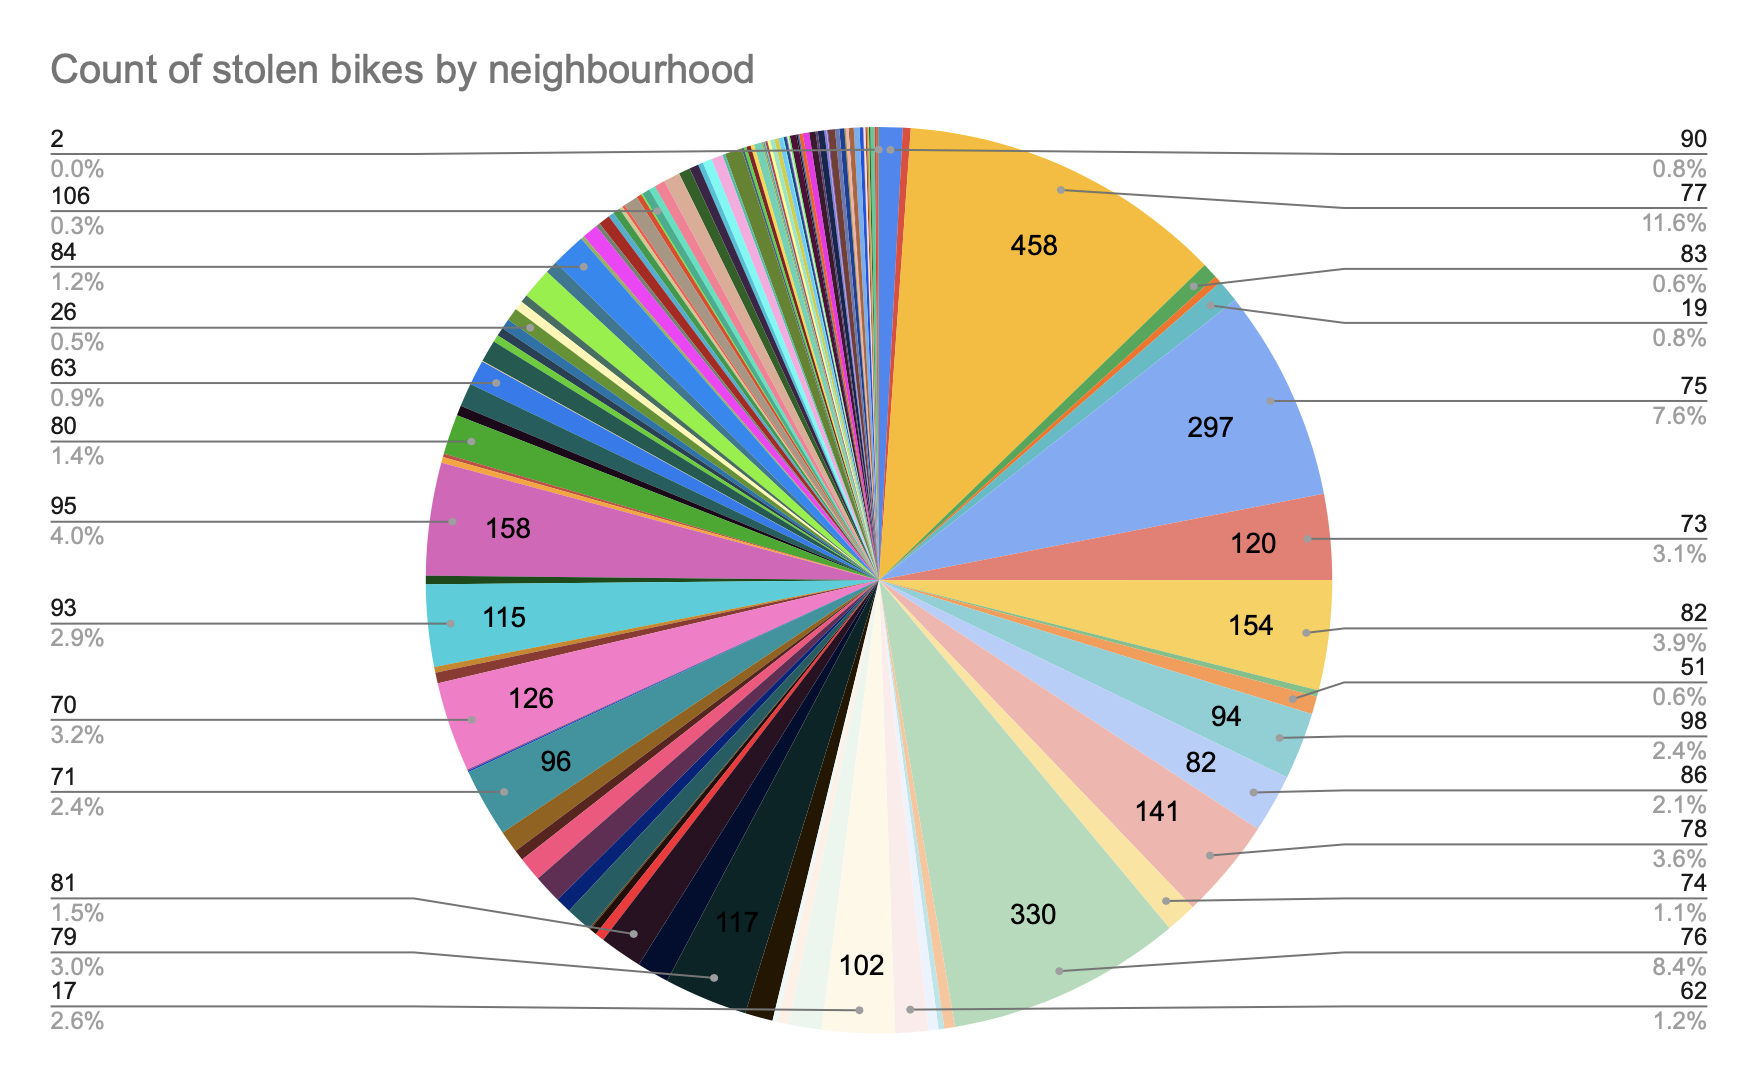
This project is an infographic of bike thefts in Toronto city. The dataset was retrieved from the Toronto Police Service–Public SafetyData Portal. The goal is to design a clear, engaging visualizations that are relevant and informative for an intended audience.
Ability to research, analyze and understand content and sets of data
Explore different possibilities within statistical and relational modes

Organizing Data
The data is organized by the location of the neighbourhoods. Despite having the whole data set for all Toronto neighbourhoods, my focus is the downtown area since the crime rate is much higher. The specific types of the location where the crimes occur are displayed for readers to compare between the top five neighbourhoods.